
By the bioMérieux Connection Editors
On February 2, the Centers for Disease Control and Prevention (CDC) published the statistics of influenza hospitalizations and fatalities for the week ending January 27, 2018, or Week 4 of the 2017-2018 Influenza Season.
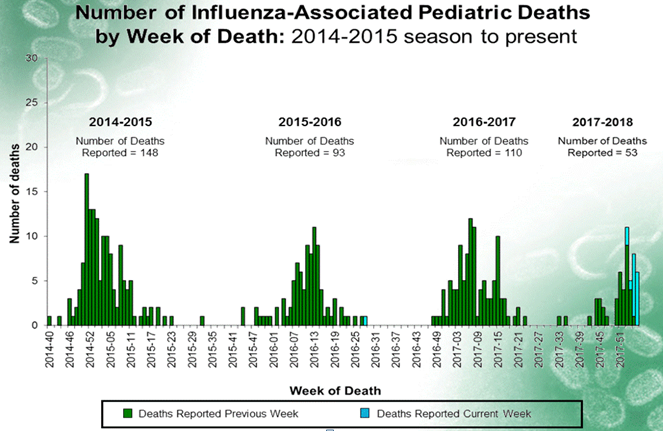
As of January 27, the CDC reports 16 additional pediatric deaths related to the flu, which brings the total number of pediatric deaths to 53 for the 2017-18 season. Since the flu season typically lasts until March and can go as late as May, it is expected that this number will continue to climb. The CDC’s FluView tracker below compares pediatric influenza fatality rates from 2014 until the current season. Prior to 2014, the highest pediatric fatality rate occurred during the 2009 pandemic, during which 358 pediatric deaths were reported.
Of the latest 16 pediatric fatalities, the CDC reported that approximately 20%—three of the children—had been vaccinated. Eight of the 16 were otherwise healthy. All 16 fatalities were associated with the three prevalent flu strains this season: Influenza A H3N2, H1N1 and Influenza B.
H3N2 is the most prevalent strain this year.
According to a state public health lab surveillance network supported by the CDC, approximately 45,000 respiratory specimens have been processed so far this season. 76% of those specimens were H3N2.
“Right now, one of the biggest health threats we are facing is influenza,” said CDC acting Director Dr. Anne Schuchat at a February 2nd CDC Update on Flu Activity. “Flu is incredibly complex and difficult to predict, and this season is a somber reminder of why flu is one of the world’s greatest public health challenges. And why we at CDC focus so intensely on efforts to fight flu. In the past week, we have seen increased influenza-like illness activity, more hospitalizations, and tragically, more flu associated deaths in children and adults.”
Based on the current trends, the CDC expects this season to surpass the 2014-2015 influenza season for laboratory confirmed influenza hospitalizations. That season, which was the worst recorded between 2010 and 2016-17, had the highest final cumulative rate of laboratory-confirmed influenza hospitalizations at 64.2 per 100,000.
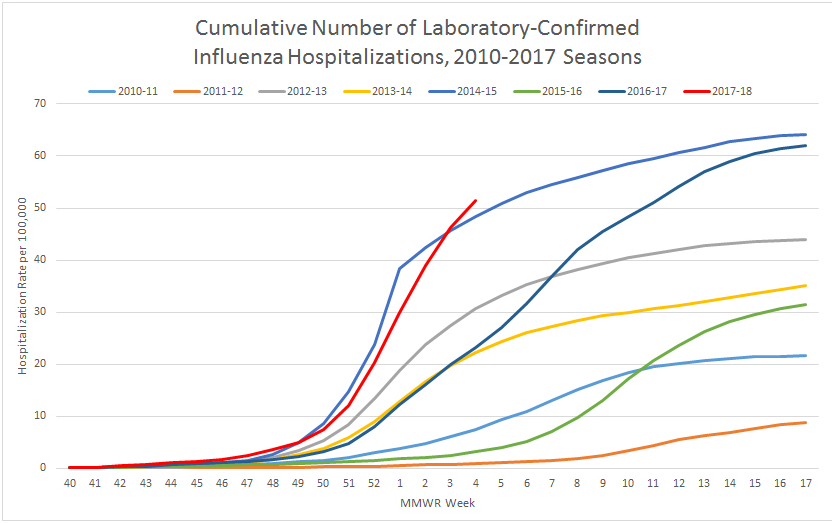
As of January 27th—roughly the midpoint of this flu season—the hospitalization rate is at 51.4 per 100,000. For comparison, the hospitalization rate during the same time period during the 2014-15 season was 48.4 per 100,000.
The cumulative hospitalization rates per 100,000 for the 2010-2017 Influenza seasons.
“As of this week, overall hospitalizations are now the highest we’ve seen,” Dr. Schuchat added. “Even higher than the 2014-15, our previous high season. We also continue to hear reports of crowded hospitals and spot shortages of antiviral medications and rapid influenza tests. Unfortunately, our latest tracking data indicate that the flu activity is still high and widespread across most of the nation and increasing overall. Influenza A H3N2 viruses continue to dominate this season.”
The CDC also reports an increase in the geographical spread of the flu this year.
During the first three weeks of 2018, 49 states reported widespread activity, which is the highest number of states with widespread flu activity reported since the CDC began collecting this data.
A network of 2,800 doctors’ offices and emergency departments report influenza statistics to the CDC’s FluView system. This network reported an increase in the percentage of patients who arrived with influenza-like illness:
- For the week ending January 20, 6.6% of patients reported flu-like illness.
- For the week ending Jan. 27, that percentage jumped to 7.1%
According to the CDC, only two previous seasons over the last 15 years witnessed weeks with greater percentages of patients reporting influenza symptoms:
- 8% reported influenza-like illness at the peak of the 2009 H1N1 pandemic
- 7.6% reported influenza-like illness at the peak of the 2003-2004 season, which was a high severity H3N2 season, like this year
Overall, influenza-like illness has been elevated for ten consecutive weeks so far this season.
According to the CDC, the average duration of the flu season, based on data collected over the years from its network of 2,900 locations, is 16 weeks, with a range of 11 to 20 weeks. This indicates that this year’s season will last well into March and perhaps later.
One bright spot in these statistics is that during the week of Jan 27, 48 states reported widespread activity, down one from a high of 49 states the week previous. Oregon fell off this list and reported less influenza activity across the state for the week. The CDC is hopeful that this represents a trend of decreasing activity and severity in the western states.
For more information, visit FluView, the CDC’s Influenza Division weekly Influenza surveillance report.
Opinions expressed in this article are not necessarily those of bioMérieux, Inc.